Booz & Company’s annual study of the world’s biggest R&D spenders shows why highly innovative companies are able to consistently outperform. Their secret? They’re good at the right things, not at everything.
s+b magazine
by Barry Jaruzelski and Kevin Dehoff
Illustration by Otto Steininger
What matters instead is the particular combination of talent, knowledge, team structures, tools, and processes — the capabilities — that successful companies put together to enable their innovation efforts, and thus create products and services they can successfully take to market. … Innovators that have achieved this state of coherence, we have found, consistently and significantly outperform their rivals on several financial measures.Image via WikipediaWhy are some companies able to consistently conceive of, create, and bring to market innovative and profitable new products and services while so many others struggle? It isn’t the amount of money they spend on research and development. After all, our annual Global Innovation 1000 study has shown time and again that there is no statistically significant relationship between financial performance and innovation spending, in terms of either total R&D dollars or R&D as a percentage of revenues.
We believe that this assessment of key innovation capabilities comes at a particularly opportune time. … (See “Profiling the 2009 Global Innovation 1000,” below.) Clearly, the global recession, which had not yet taken its toll on the world of innovation in 2008, finally came home to roost last year. Yet that decline makes it even more imperative that companies spend their available R&D dollars wisely. Our goal this year is to examine the capabilities needed to maximize the impact of a company’s innovation efforts in good times and bad, and to highlight the benefits both of focusing on the short list of capabilities that generate differential advantage, and of clearly linking the specific decisions within innovation to the company’s overall capabilities system and strategy.
Strategies and Capabilities
Three years ago, in 2007, we focused our annual innovation study on how companies use distinct innovation strategies to create their products and take them to market. Nearly every company, we found, followed one of three fundamental innovation strategies:
Need Seekers actively and directly engage current and potential customers to shape new products and services based on superior end-user understanding, and strive to be the first to market with those new offerings.
Market Readers watch their customers and competitors carefully, focusing largely on creating value through incremental change and by capitalizing on proven market trends.
Technology Drivers follow the direction suggested by their technological capabilities, leveraging their investment in research and development to drive both breakthrough innovation and incremental change, often seeking to solve the unarticulated needs of their customers via new technology.
It is important to note that we found that none of these three strategies were any better than the others at producing sustained superior financial results, although of course individual companies outperform others within each strategic group. The success of each of the strategies depends on how closely companies, in pursuing innovation, align their innovation strategy with their business strategy and how much effort they devote to directly understanding the needs of end-users.
This year we set out to answer two new questions: Which sets of capabilities are the most critical for the success of each of the three strategies? And do companies that focus on those critical capabilities see improved overall financial results? …
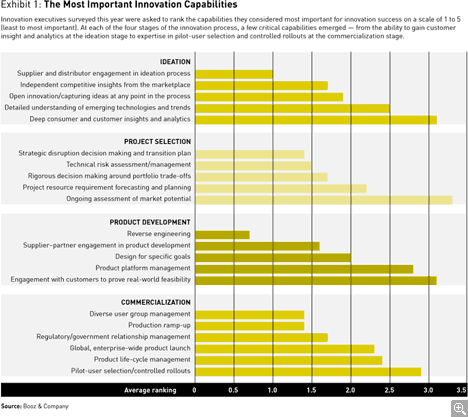
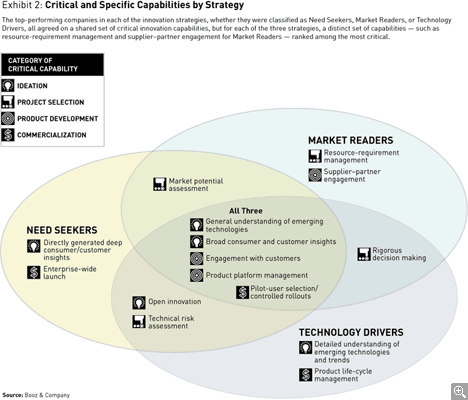
Innovation capabilities enable companies to perform specific functions at all the stages of the R&D value chain — ideation, project selection, product development, and commercialization. We asked respondents to this year’s Global Innovation 1000 survey to identify which capabilities were most important in achieving success at innovation. (See Exhibit 1.) Then, in hopes of getting further insight into which capabilities companies ought to work toward, we looked at the capabilities focused on by the top 25 percent of performers within the group using each of the three innovation strategies. (See Exhibit 2.)
No matter which of the three innovation strategies they pursued, all the successful companies depended on a common set of critical innovation capabilities. These include the ability to gain insights into customer needs and to understand the potential relevance of emerging technologies at the ideation stage, to engage actively with customers to prove the validity of concepts during product development, and to work with pilot users to roll out products carefully during commercialization.
In addition to these common capabilities, companies among the top 25 percent in performance within each strategic group depend on a set of distinct capabilities they feel are critical to achieve success, some of which overlap with those of other strategies. The most successful companies, we found, are those that focus on a particular, narrow set of common and distinct capabilities that enable them to better execute their chosen strategy.
Profiling the 2009 Global Innovation 1000
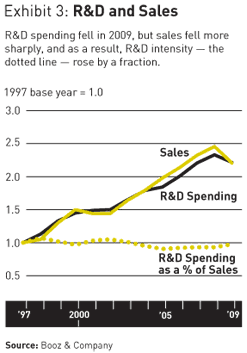
The global recession finally caught up with the world’s top innovators in 2009. Following a relatively strong 2008, during which total R&D spending continued to grow despite the recessionary headwinds, the 1,000 companies that spent the most on research and development decreased their total R&D spending in 2009 by 3.5 percent, to US$503 billion.
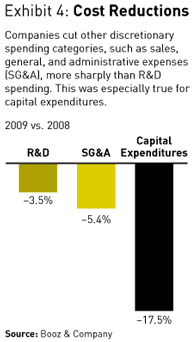
… Revenue for the Global Innovation 1000 plunged at an 11 percent rate, from $15.1 trillion in 2008 to $13.4 trillion in 2009 — nearly three times the rate of decline in R&D spending. The result was that R&D intensity (innovation spending as a percentage of revenue) actually increased, from 3.5 percent to 3.8 percent, indicating that companies attempted to stay the course with their overall innovation programs, and that they continue to see innovation as essential for future growth. (See Exhibit 3.) Compared to the 3.5 percent reduction in R&D spending, the 1,000 top R&D spenders cut much more deeply into both sales, general, and administrative expenses (a 5.4 percent reduction) and capital expenditures (a 17.5 percent drop). (See Exhibit 4.)
The reductions in R&D spending, however, were neither as widespread nor as evenly distributed among industries as the overall numbers might suggest. Just over half of all the companies we tracked this year cut their R&D spending in 2009. Nearly all the cuts, however, came in just three industries: auto, computing and electronics, and industrials. The other industries increased spending to a greater or lesser degree. (See Exhibit 5.)
The auto industry alone accounted for fully two-thirds of the $18 billion contraction in R&D spending — … A large number of auto parts suppliers fell into bankruptcy protectionlast year, and virtually every company in the industry cut spending in all areas of operations. Still, the industry’s 14 percent decrease in R&D spending was roughly in line with its 12.7 percent decrease in revenue; as a result, the auto industry’s R&D intensity was essentially unchanged, at 3.9 percent.
The computing and electronics industry reported similar but less drastic R&D spending reductions. The industry’s revenues were down by 7 percent from 2008 as a result of the recession and the accompanying drop in sales. Yet as with autos, the decline in R&D spending for computing and electronics — 7 percent — tracked the decline in revenue, so there was virtually no change in the industry’s R&D intensity.
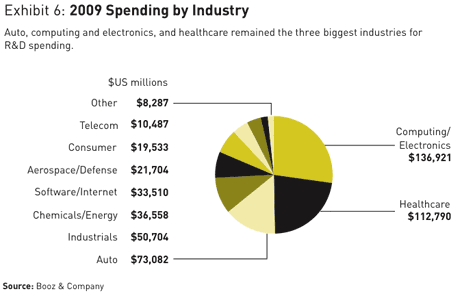
Despite the $9.7 billion decline in its R&D spending, computing and electronics kept its top spot as the biggest spender on innovation, while autos remained at number three. (See Exhibit 6.) The industry in the number two spot, healthcare, increased its R&D spending by 1.5 percent — much slower than the industry’s recession-defying revenue growth rate of 6 percent.
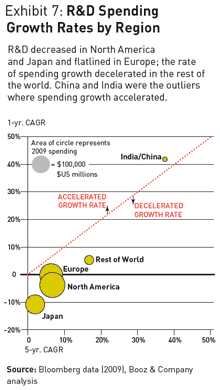
Given the recession’s overall effect on innovation spending, it’s not surprising that companies headquartered in the regions that were hit hardest cut their R&D spending the most, on average. … (See Exhibit 7.)
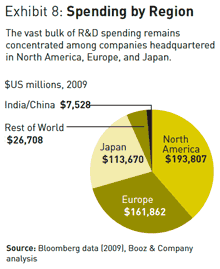
The innovation programs of companies based in China and India, on the other hand, seemed unaffected by the recession: They boosted R&D spending by 41.8 percent (albeit from a small base; they account for only 1 percent of total Global Innovation 1000 corporate R&D spending). (See Exhibit 8.)
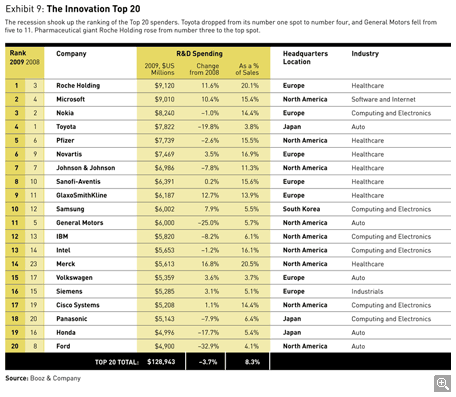
Changes in the list of the top 20 spenders provided further signs of the times. … (See Exhibit 9.) Toyota cut spending almost 20 percent, while its R&D intensity fell to 3.8 percent from 4.4 percent in 2008 — no doubt a direct result of its first-ever loss (more than $4.3 billion that year). Other automakers also fell on the Top 20 list, while most companies in computing and electronics rose a notch or two.
Taking over the number one position was pharmaceutical giant Roche Holding Ltd., which boosted its R&D spending 11.6 percent, to $9.1 billion. Indeed, healthcare companies took six of the top 10 spots on the list, and seven of the top 20. Coming in at number 1,000 was the medical manufacturer Seikagaku Corporation, which spent $59.5 million in 2009, down 7.5 percent from the previous year.
In hindsight, given the severity of the recession and the economic uncertainty that gripped the world, it seems inevitable that companies would cut their innovation budgets in 2009. Still, their overall unwillingness to reduce spending in line with their decline in revenues is a tribute to the importance companies in every industry now place on innovation as a key source of growth. Thus, with the recession drawing to a close and companies continuing to post strong earnings, 2010 will be an important test of their innovation mettle: The most forward-looking companies will move quickly to restore or even increase the R&D spending they cut in 2009 and to deploy it still more effectively.
— B.J. and K.D.
Need Seekers
The distinct strategy of Need Seekers is to ascertain the needs and desires of consumers and then to develop products that address those needs and get them to market before the competition does. The capabilities required for success begin at the ideation stage, where Need Seekers pursue open innovation and directly generated, deep consumer and customer insights and analytics, as well as a detailed understanding of emerging technologies and trends, in order to identify both their customers’ needs and the technology trends that can help them meet those needs.
An example is Stanley Black & Decker Inc.’s DeWalt division, a maker of power tools for professional contractors. In its efforts to connect directly with customers even before it starts selecting which projects to develop, DeWalt regularly sends people out to construction sites to research builders’ needs and observe construction crews in action. One notable result of such efforts was the development of a 12-inch miter saw, which became one of the company’s bestsellers, after researchers watched carpenters struggle to cut large pieces of molding on the industry-standard 10-inch saw.
Need Seekers generally continue to remain connected to customers both during the project selection process, in which ongoing assessment of market potential is a key capability, and during product development, when it is critical for Need Seekers to engage with customers to prove the real-world feasibility of their products. At DeWalt, for instance, once prototypes of new products have been completed, engineers and marketers take them back to the same job sites where the research was originally done. They leave the new tools with the customers, and come back a week or so later to collect information on how the tools performed. That information feeds directly into the company’s iterative development process.
Given that Need Seekers frequently depend for their success on developing technically innovative products, a further key capability at the project selection stage involves technology risk assessment and management. At the Xerox Corporation, for example, Steve Hoover, vice president of R&D in charge of software development for the company’s products, notes the importance of risk management in assessing the potential business value of any project under development. “How big an opportunity are you going after here?” he asks. “What will drive its value? Where are the biggest technical risks? What might cause the project to fail? You’re looking for correlations. Where there’s risk, you have to put in the extra work to ensure you capture the potential value.”
At the commercialization stage, Need Seekers value pilot-user programs and global product launches as crucial for keeping in touch with customers even as they scale up their sales efforts to capture the maximum value of being first to market. Both DeWalt and dental equipment maker Dentsply rigorously assess the percentage of sales coming from new products. For Xerox, which sells its products around the world, managing the launch phase is a critical and highly complex endeavor, designed to accommodate the long lead times, logistics, and training needs involved in selling large and sophisticated machines in very diverse markets.
Market Readers
Market Readers, on the other hand, pursue their customers more cautiously, preferring to innovate incrementally and keeping a close eye on the innovations of competitors. …
Tim Yerdon is director of innovation and design at Visteon, a global auto parts manufacturer. But his real focus, he says, is “to look at market trends and translate those trends and needs into new products and services.” That’s why taking accurate readings of the marketplace at both the ideation and the project selection stages is a key capability for Visteon. A case in point is the company’s development of reconfigurable digital displays for cars. …[Consumers] were clearly happy with the flat-screen TVs they were buying for their homes. Says Yerdon: “We did the market research, we put all these data points together, and we could see where the trends were going.” In late 2009, Visteon successfully launched its first reconfigurable displays.
The success of the Market Readers strategy depends on managers making sure the right products hit the market at the right time. … At the Parker Hannifin Corporation, a diversified manufacturer of industrial equipment, this understanding led to the implementation of a highly disciplined stage-gate process for green-lighting projects, embedded in every division in the company. Parker Hannifin treats its general managers and their staff as venture capitalists who are being asked to invest the company’s money in certain projects. The rigorous value screens that the company has developed as part of this process have enabled management to filter out the good projects from the bad much more successfully than before.
For companies like Visteon, an equally critical capability is engagement with customers to prove real-world feasibility throughout the product development stage. By working actively with automakers, says Visteon’s Yerdon, “we’re taking a substantial amount of risk out of the system. Rather than coming up with an idea, building it, and then bringing it to a customer, only to find out they don’t want it, we’re much better off working together and more openly.”…
Technology Drivers
Technology Drivers begin with a different approach to ideation, using their technological prowess to develop products their customers may not know they need. … In addition, Technology Drivers must ensure that their technical personnel have time to ideate: This is the rationale for Google’s well-known “70-20-10” rule, which directs engineers to spend 70 percent of their time on core business tasks and 20 percent on related projects, but allows them to spend 10 percent of their time pursuing their own ideas.
…The German technology giant Siemens AG, for example, spends 5 percent of its overall R&D budget on planning for the long term, which involves developing detailed technology road maps within individual business units, as well as longer-range scenarios of future technology trends at the corporate level. This dual process has generated perspectives that have enabled the company to expand its large health technologies business into new areas such as personalized healthcare. And Siemens works hard to track the payback from its centralized innovation office in the form of actual new products launched.
The Masco Corporation, an $8 billion building products company, … seeks to be ready to leverage new technologies no matter where they can be found. A few years back, company representatives noticed some interesting technology at a trade show — a wireless, battery-less switch, which they were sure would have applications in the home. “We vetted the technology, brainstormed specific applications for the home, and developed a pilot,” recalls Thom Nealssohn, manager of innovation implementation services at Masco. “Every time we showed it to someone, we learned a little bit more, and that gave us the fuel that we needed to go back and make it better.” Masco launched a new line of innovative programmable lighting products based on the technology — Verve Living Systems — in 2009.
… “In many cases, it’s just a matter of sitting down and saying, ‘Here’s the problem we want to solve,’” Nealssohn says. “What really differentiates us is our willingness to partner with customers, to try not only to understand what issues they’re struggling with today, but to anticipate issues that may arise as a result of what we see going on in the world around us.” That strategy, in turn, demands that Technology Drivers like Masco also focus on rigorous decision making in R&D portfolio trade-offs at the project selection stage, if they are to funnel their wide-ranging ideas into products that can succeed in the market.
Finally, because of the nature of their products, Technology Drivers must pay strict attention to two key capabilities in the commercialization stage: pilot-user selection/controlled rollouts, and product life-cycle management. … Says Nealssohn: “We believe that everyone in the distribution chain has to win. A shift of margin from one partner in the chain to another does not necessarily equate to a winning product. So it doesn’t matter how much the customer wants the product — if the distributor or the home builder doesn’t see the opportunity to make money, chances are that product is going to struggle or even fail.”
Focus Matters
The capabilities required to pursue each strategy form a systematic set of skills, processes, and tools that companies must focus on to succeed at each stage of the innovation process. In contrast to top-performing innovators such as Apple, Google, Xerox, Visteon, and Siemens, the poorest-performing companies within each strategic group — those among the bottom 25 percent — take a less-focused approach to the most critical innovation capabilities.
These lower-performing companies, regardless of which of the three strategies they are pursuing, cite only three common capabilities as important: early customer insight, assessment of market potential during project selection, and engaging with customers at the development stage. …. Notably, there is significantly less overlap among the capabilities that low-performing companies depend on. This suggests that these companies take more of a scattershot approach to building the innovation capabilities systems they need. This lack of focus, we believe, is a primary cause of their inferior performance.
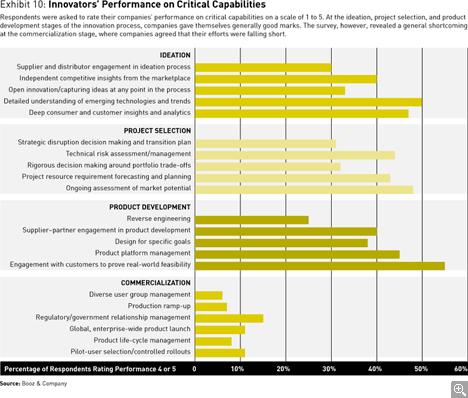
Focusing on a systematic set of capabilities means that companies must first choose the capabilities that matter most to their particular innovation strategy, and then execute them well. Our analysis suggests, however, that although most companies are relatively strong at executing critical capabilities within the areas of ideation, project selection, and product development, they underperform at the commercialization stage. (See Exhibit 10.) Executives agree consistently that there are three customer- and market-oriented capabilities that matter most: Gathering customer insights during the ideation stage, assessing market potential during the selection stage, and engaging with customers during the development stage. Yet when it comes to the capabilities needed to introduce their products into the market, there is no single one consistently named as a strength. …
In commercialization, the top performers stand out by executing well in two critical areas: global product launches and pilot-user selection and rollout. … Xerox’s Hoover acknowledges just how important the company-wide process of launching products in the marketplace is in the ability to capture the business value of innovation. “What do we have to get done, and when, so that we can feed the new product into the global operating companies’ pipeline, and what do they have to have ready so they can push it out? It’s really basic project management, but it has to be executed really well.”
Aligning with Corporate Strategy
Companies that focus on a consistent set of innovation capabilities clearly outperform their rivals. … Innovation — and the particular strategies companies employ to pursue innovation — is just one aspect of every company’s efforts to succeed in the marketplace. (See “The 10 Most Innovative Companies.”) They must also excel in areas outside R&D, including manufacturing, logistics, sales, marketing, and human resources. And their innovation efforts must be in sync with their overall corporate strategy: They must integrate the right innovation capabilities with the right set of firm-wide capabilities, as determined by their overall strategy.
The 10 Most Innovative Companies
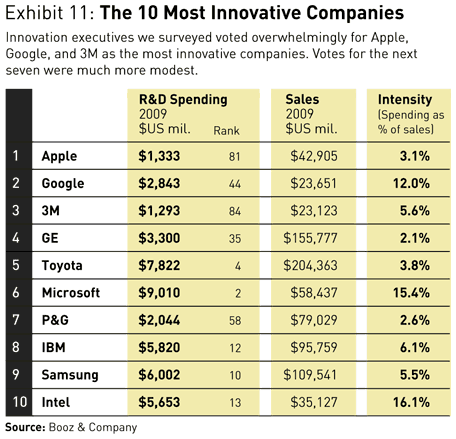
Every year, readers of the annual Global Innovation 1000 study — which tracks the companies that spend the most on innovation — ask us which companies are in fact the most innovative. … As part of our survey exploring the relationship between innovation capabilities, corporate strategy, and financial performance, we asked more than 450 innovation leaders in more than 400 companies and 10 industries to name the three companies they considered to be the most innovative in the world.
Our survey participants’ collective opinion suggests that their views are very much in line with popular perception. Apple far and away leads the Top 10, capturing 79 percent of the vote; it is followed by Google, with 49 percent; 3M is in third place, with 20 percent. Apple is an exceptional example of our observation that success in innovation is determined not by how much money you spend, but rather by how you spend it. The company has a long history of bringing innovative and stylish products to market, from the first Apple personal computer in 1976 to the iPod, the iPhone, and the iPad today. Yet it invests just 3.1 percent of its revenues in R&D, less than half the average percentage of the computing and electronics industry. Apple’s financial performance has been stellar: a five-year total shareholder return (TSR) of 63 percent. Second-place Google’s five-year TSR is even more impressive, at 102 percent; its R&D intensity (innovation spending as a percentage of revenue), at 12 percent, is just 1.3 percentage points lower than the average of the software and Internet industry as a whole. Third-place 3M has been seen as a highly innovative company for many years, and its five-year TSR of almost 50 percent shows that it continues to spend its R&D money in the right places. (See Exhibit 11.)
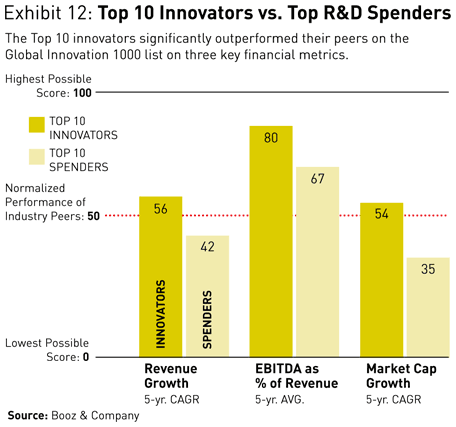
Only three of the companies on the “10 most innovative” list — Toyota, Microsoft, and Samsung — also appear among this year’s top 10 spenders, reiterating the lack of correlation between R&D spending and innovation results. … The results are clear: The most innovative companies outperformed their industry peers on three different indicators of financial success. (See Exhibit 12.)
Companies that are perceived to be highly innovative are clearly successful in creating new products and bringing them to market. Some spend more than others to accomplish this goal, but the real winners, financially speaking, are those companies, like Apple, Google, and 3M, that can innovate successfully without breaking the bank.
— B.J. and K.D.
Why is strategic alignment so critical? As part of corporate strategy, every company needs to ask itself what business it is really in, and how it intends to win — and then ask the individual business units the same question. … On the one hand, the business units, which are so much closer to the customer, must first see an opportunity, and begin to innovate. On the other hand, corporate strategists must manage the companywide R&D and sales agenda necessary to compete successfully, even as they work to minimize spending and make the process as efficient as possible. As we demonstrated in 2007, companies that achieve a tight alignment of their firm-wide and innovation strategies on average generate 40 percent higher operating income growth and 100 percent greater total shareholder return.
The Coherent Innovator
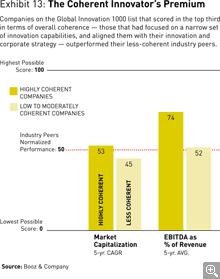
Companies that develop the relatively cohesive set of innovation capabilities we have outlined, and then combine them with similarly distinctive firm-wide capabilities — thus aligning their innovation strategy with the overall corporate strategy — can be said to be coherent. …By comparing the financial results of highly coherent companies in the Global Innovation 1000 to their less-coherent rivals, we found that, when normalized, the profit margins of companies ranked in the top third in terms of coherence were 22 percent higher, on average, than those of companies in the bottom two-thirds, and that the coherent companies achieved 18 percent greater market capitalization growth as well. (See Exhibit 13.) In general, the more coherent a company is, the more competitive success it will have — and the more it will be able to generate the higher margins that result from being truly differentiated.
Why are strong margins associated with higher coherence? Optimizing the proper set of capabilities allows companies to focus on what matters most, and not spread effort and resources across a wide range of capabilities that are less critical. … Regarding market cap growth, as companies gain the differentiating capabilities that give them coherence, their built-in advantage enables them to improve earnings growth, a key metric that the stock market takes into account when pricing a company’s shares.
Apple is the classic example: In the early 1990s, the company squandered enormous resources and billions of dollars on a series of failed products like printers, scanners, and the Newton PDA. … But once Steve Jobs returned as chairman and CEO in 1997, Apple began to focus its portfolio and its capabilities. The company has since concentrated very selectively on what it does well, and what really differentiates it from its peers: deep understanding of end-users, a high-touch consumer experience, intuitive user interfaces, sleek product design, and iconic branding. For example, Apple narrowed its product line and began leveraging the Apple brand through its Apple Store retail strategy.
The results speak for themselves. Apple’s profitability and market cap are well above the industry average, and this year our survey respondents voted it far and away the most innovative company — all of which it achieved while consistently spending far less on R&D as a percentage of sales than the median company in the computing and electronics sector.
Innovators and Strategists
The virtue of thinking about innovation in terms of capabilities and the capabilities systems that enable companies to be coherent is that it provides a specific way of talking about what companies need to focus on to translate their innovation efforts into sustained success. …As Xerox’s Steve Hoover puts it, “If a certain competency has nothing to do with how you’re positioning yourself in your market and creating value for your customers, then don’t oversupply it. Put your energy elsewhere, where you are going to differentiate.”
Companies, by focusing on the capabilities they believe are critical differentiating factors in their efforts to conceive of, develop, and sell their product in their particular markets — on what they need to do better than competitors — can gain the coherence necessary to outperform. And that, of course, is what innovation — and corporate strategy — is really all about.
Booz & Company Global Innovation 1000: Methodology
Booz & Company identified the 1,000 public companies around the world that spent the most on research and development in 2009. … This is the same core approach we have used in the previous five years of the study.
For each of the top 1,000 companies, we obtained key financial metrics for 2002 through 2009, including sales, gross profit, operating profit, net profit, R&D expenditures, and market capitalization. … In addition, total shareholder return was gathered and adjusted for each company’s corresponding local market.
Each company was coded into one of nine industry sectors (or “other”) according to Bloomberg’s standard industry designations, and into one of five regional designations as determined by each company’s reported headquarters location. To enable meaningful comparisons across industries, we indexed the R&D spending levels and financial performance metrics of each company against its industry group’s median values.
This year, to better understand the relationship between innovation strategy and capabilities, we also conducted a Web-based survey of more than 450 senior managers and R&D professionals from more than 400 different companies around the globe. …Respondents came from all industry sectors; 52 percent came from North America, 33 percent from Europe, and 15 percent from the rest of the world.
We asked respondents to evaluate the innovation capabilities they believed were most important across the value chain, as well as their performance in each of these capabilities. Responses were analyzed with a variety of statistical methods to allow us to distinguish the capabilities most important in pursuing each of the three innovation strategies we defined in our 2007 study. Although company names and responses were kept confidential (unless permission to use them was explicitly given), a large number of the respondents identified themselves, enabling us to associate their survey answers with their company’s performance. Financial performance was normalized by industry to compare the impact of capability coherence on corporate financial performance both within strategies and across all companies.




No comments:
Post a Comment